REAL GEARBOX CASE
Deutz-Fahr tractor gearbox failure (Deutz-Fahr)
Dedicated case-study page for complete images, tables, solver outputs and engineering interpretation.
CASE OVERVIEW
Premature gear failure associated with an adverse contact condition
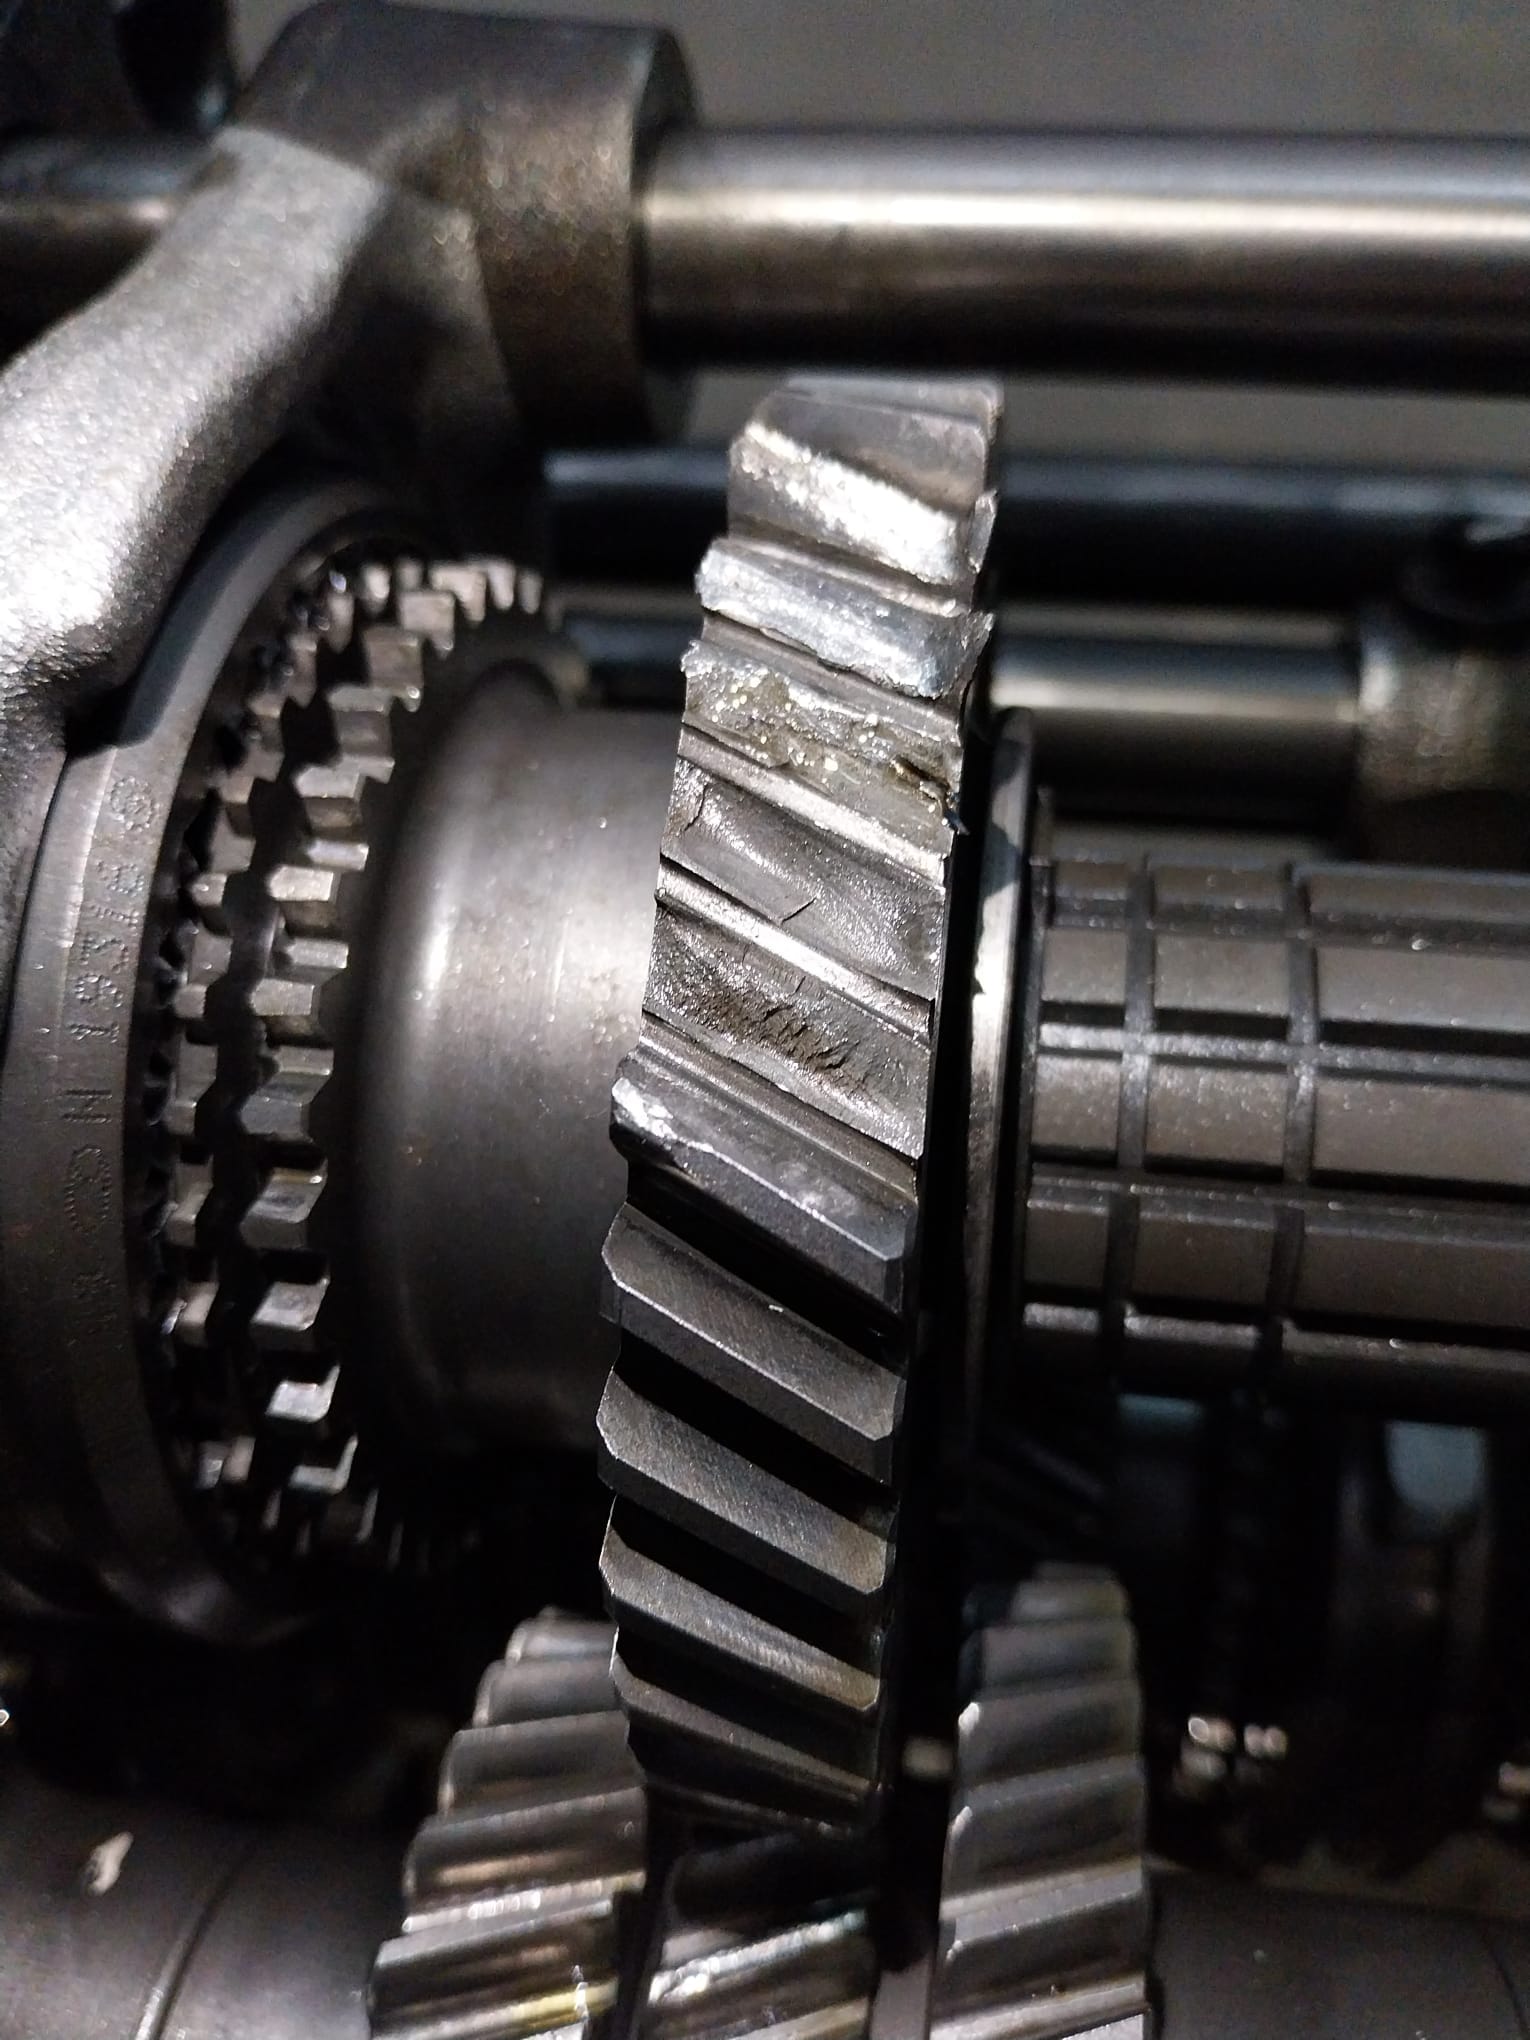
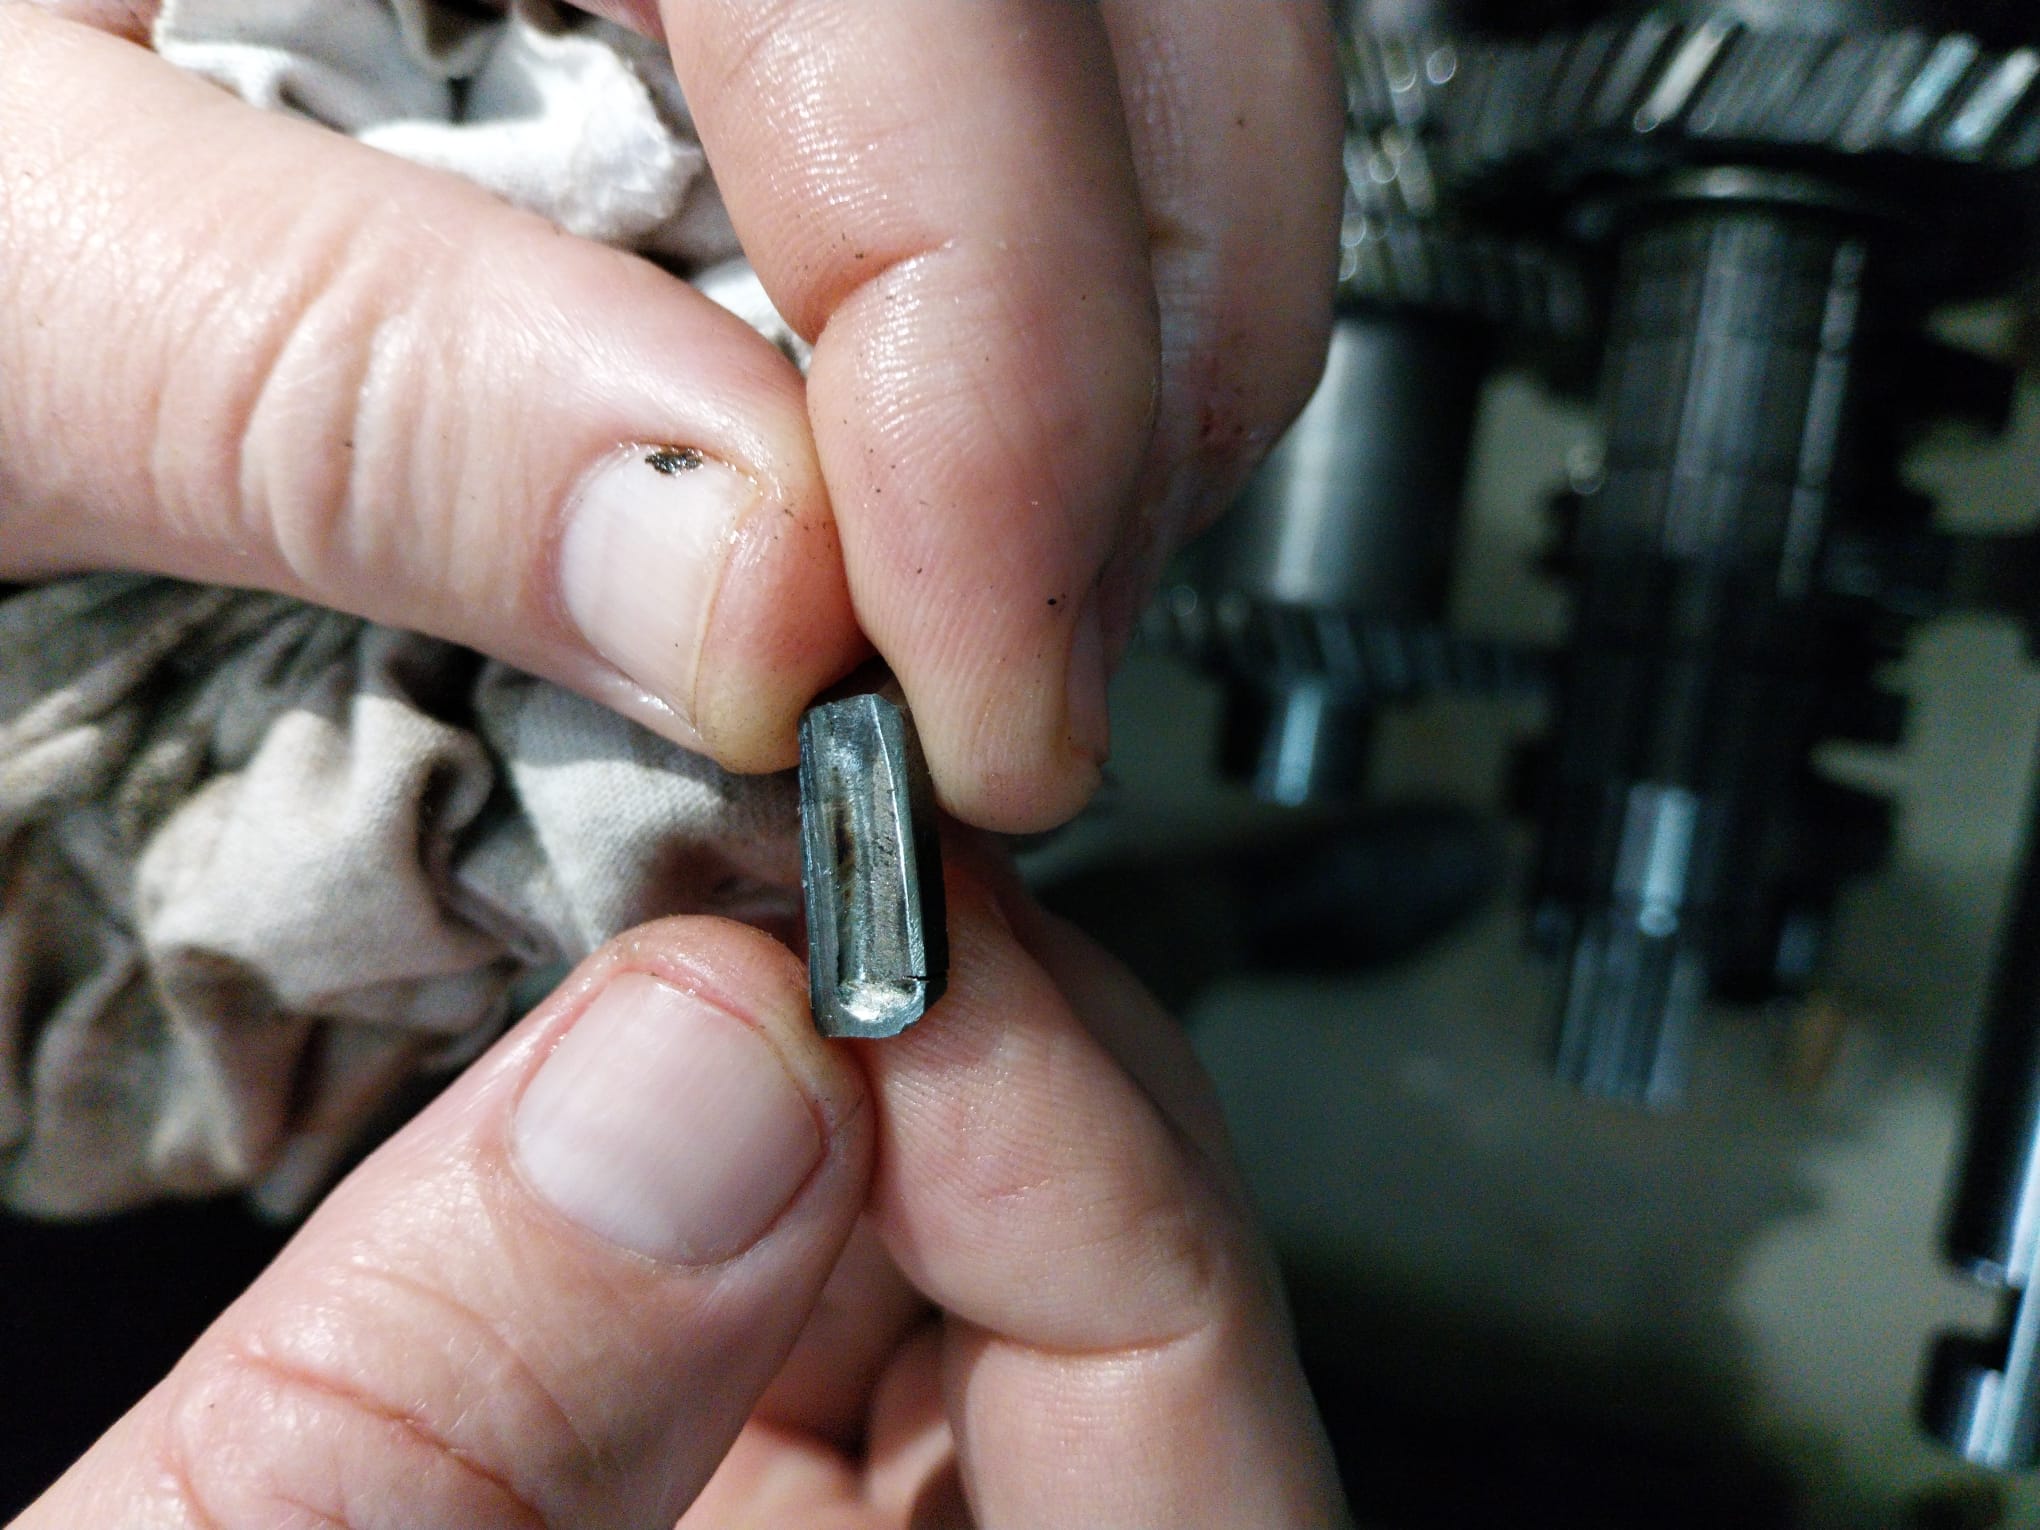
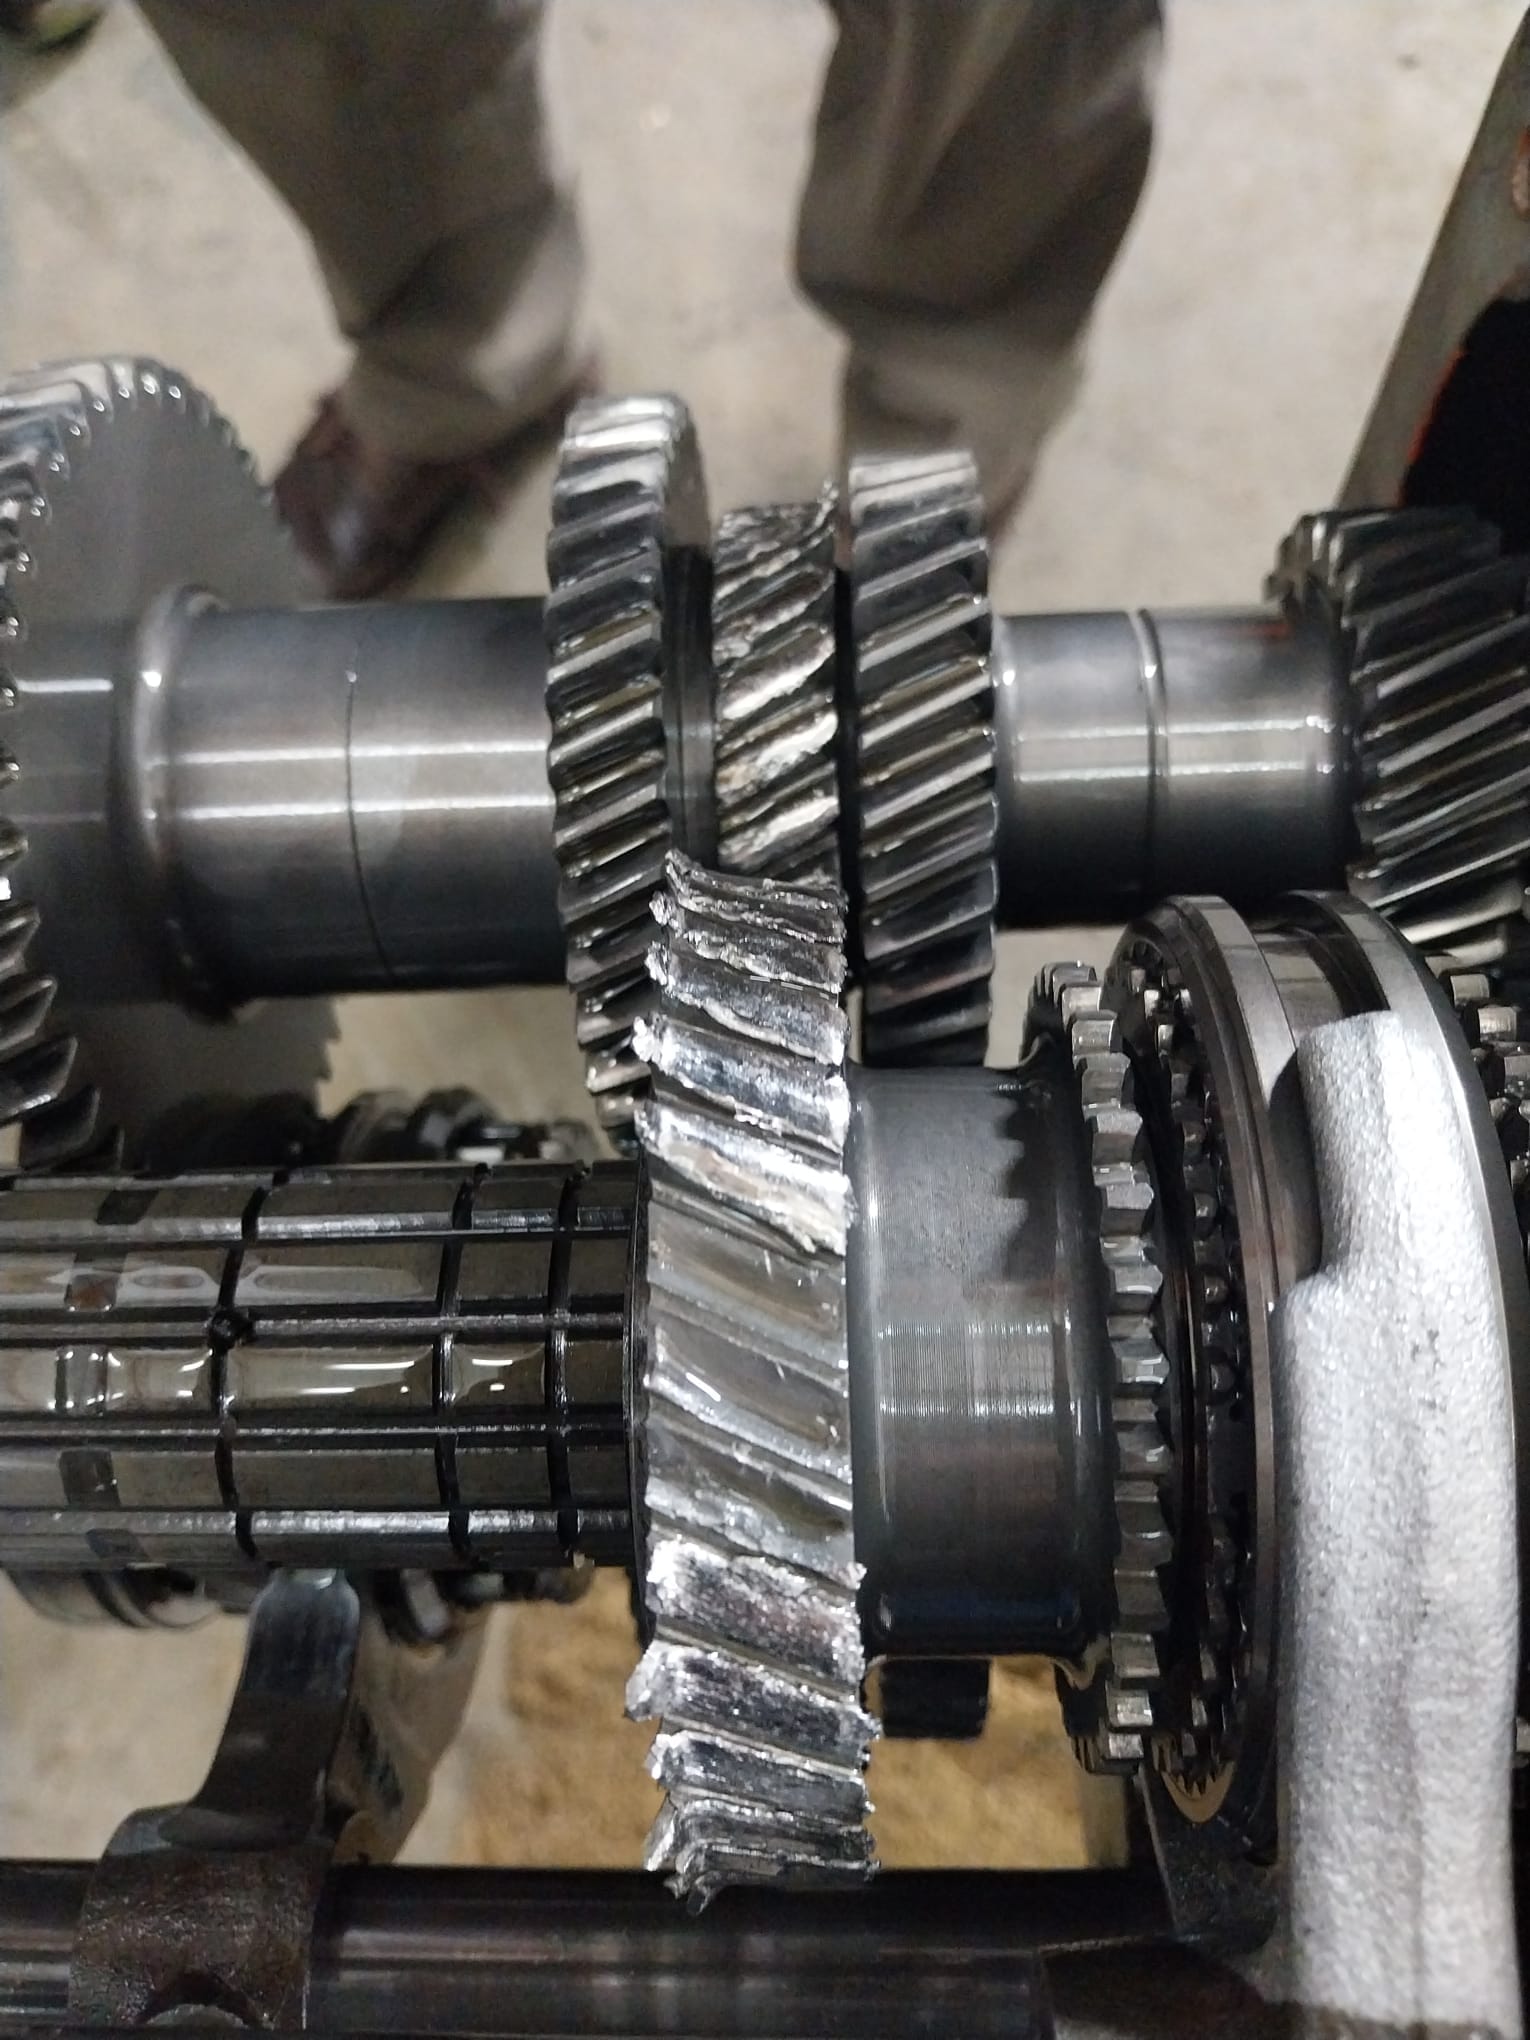
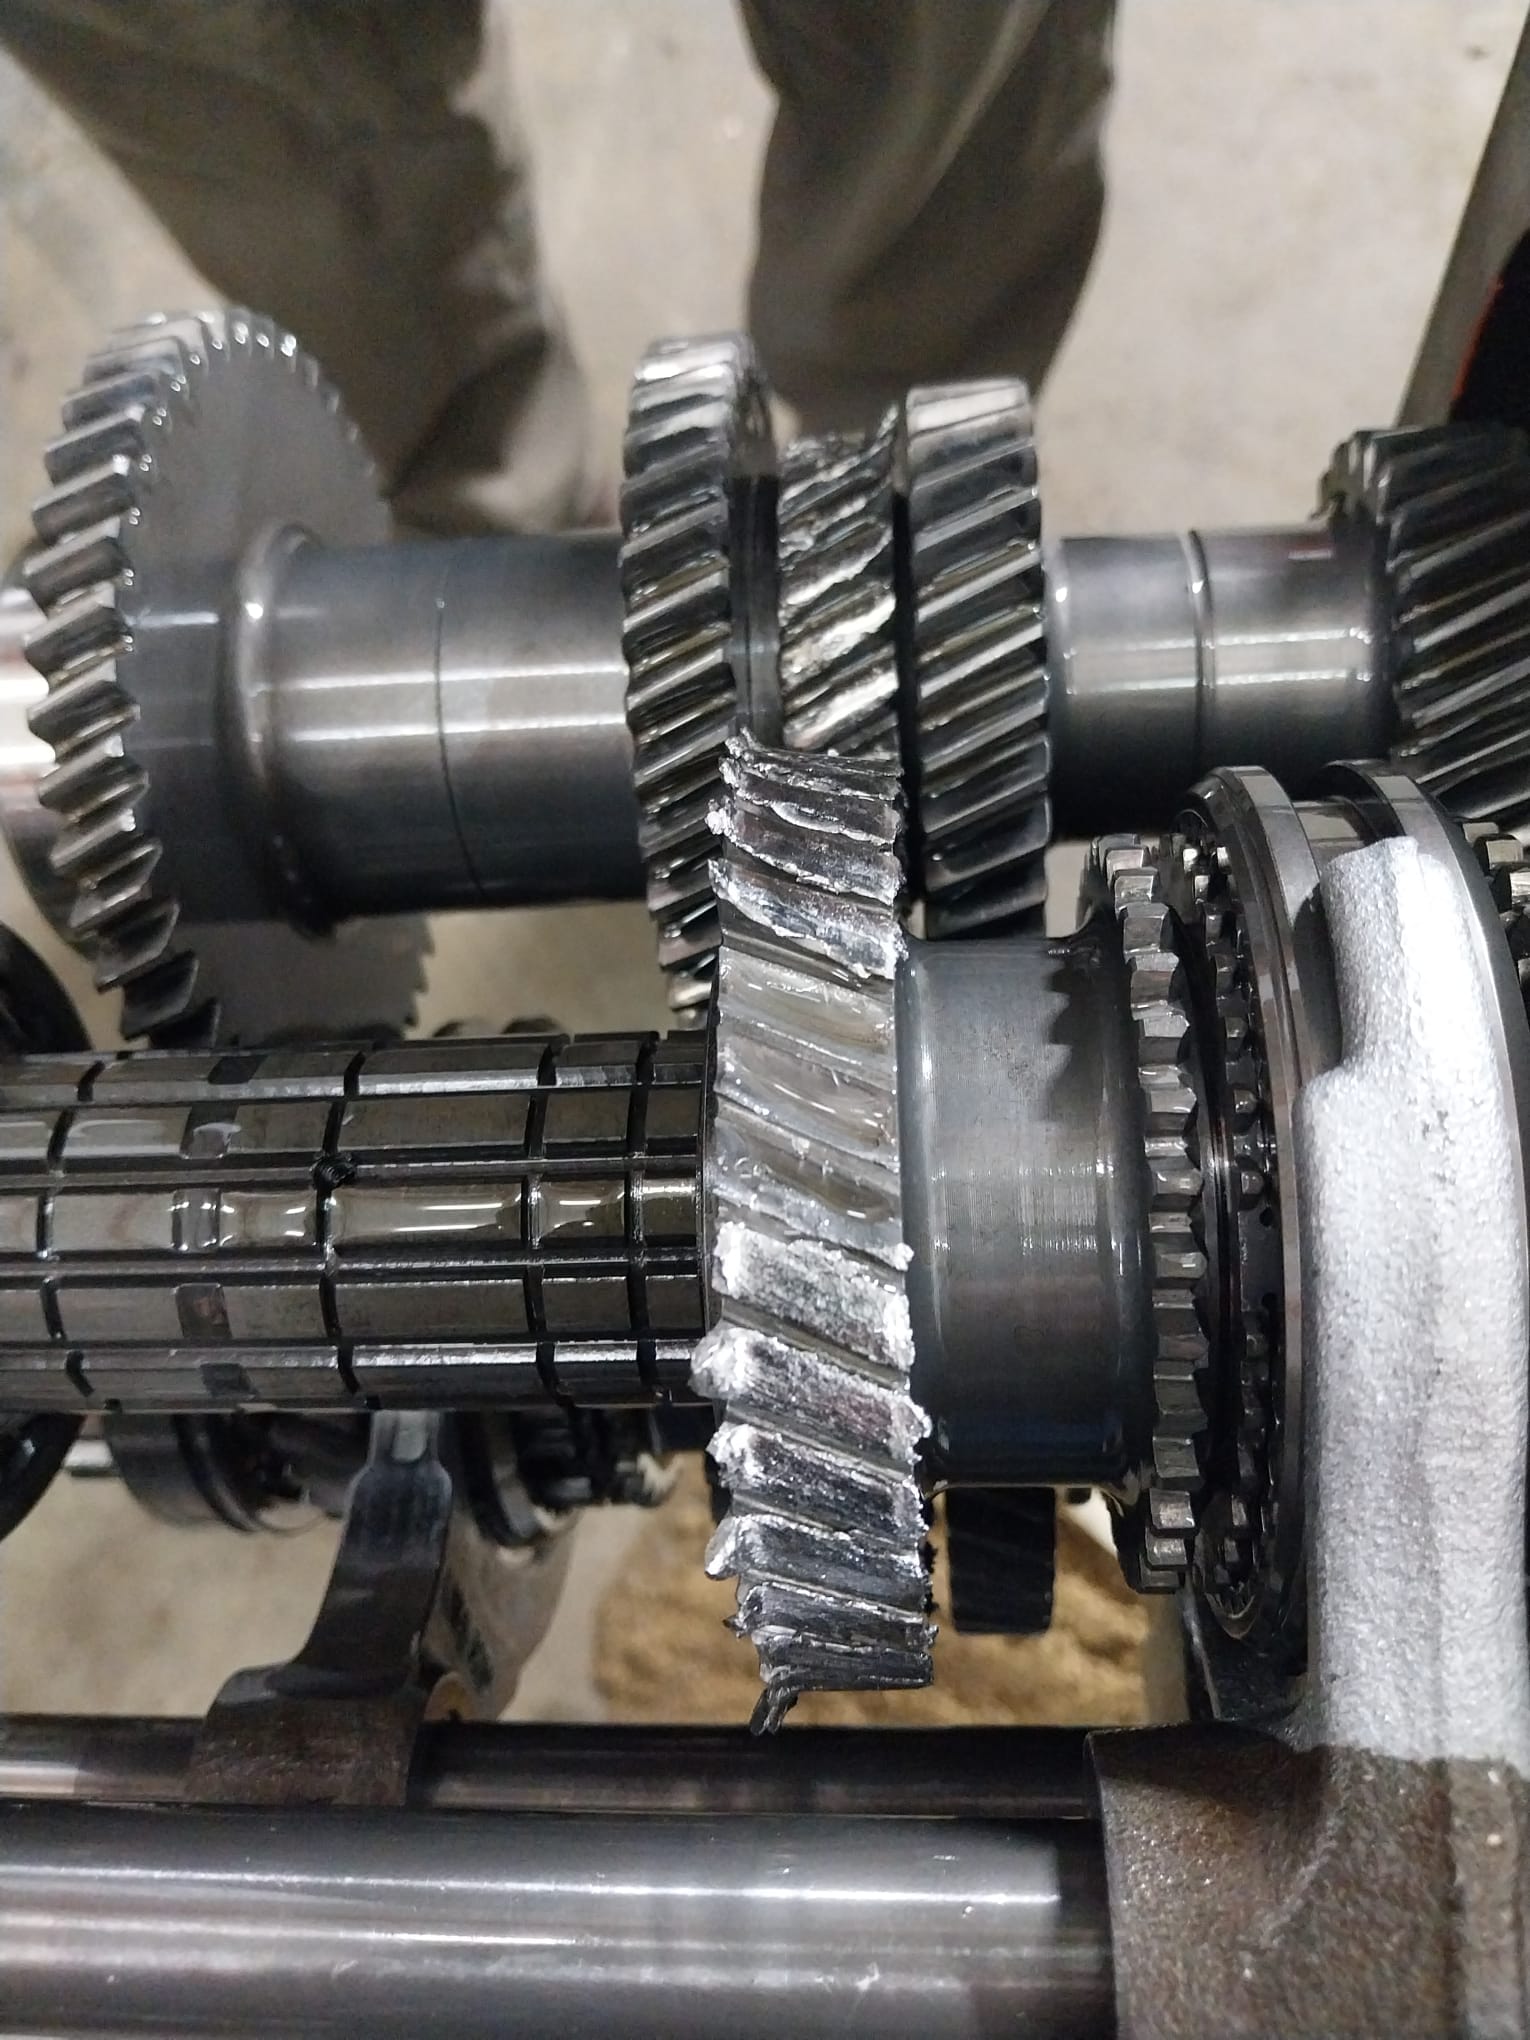
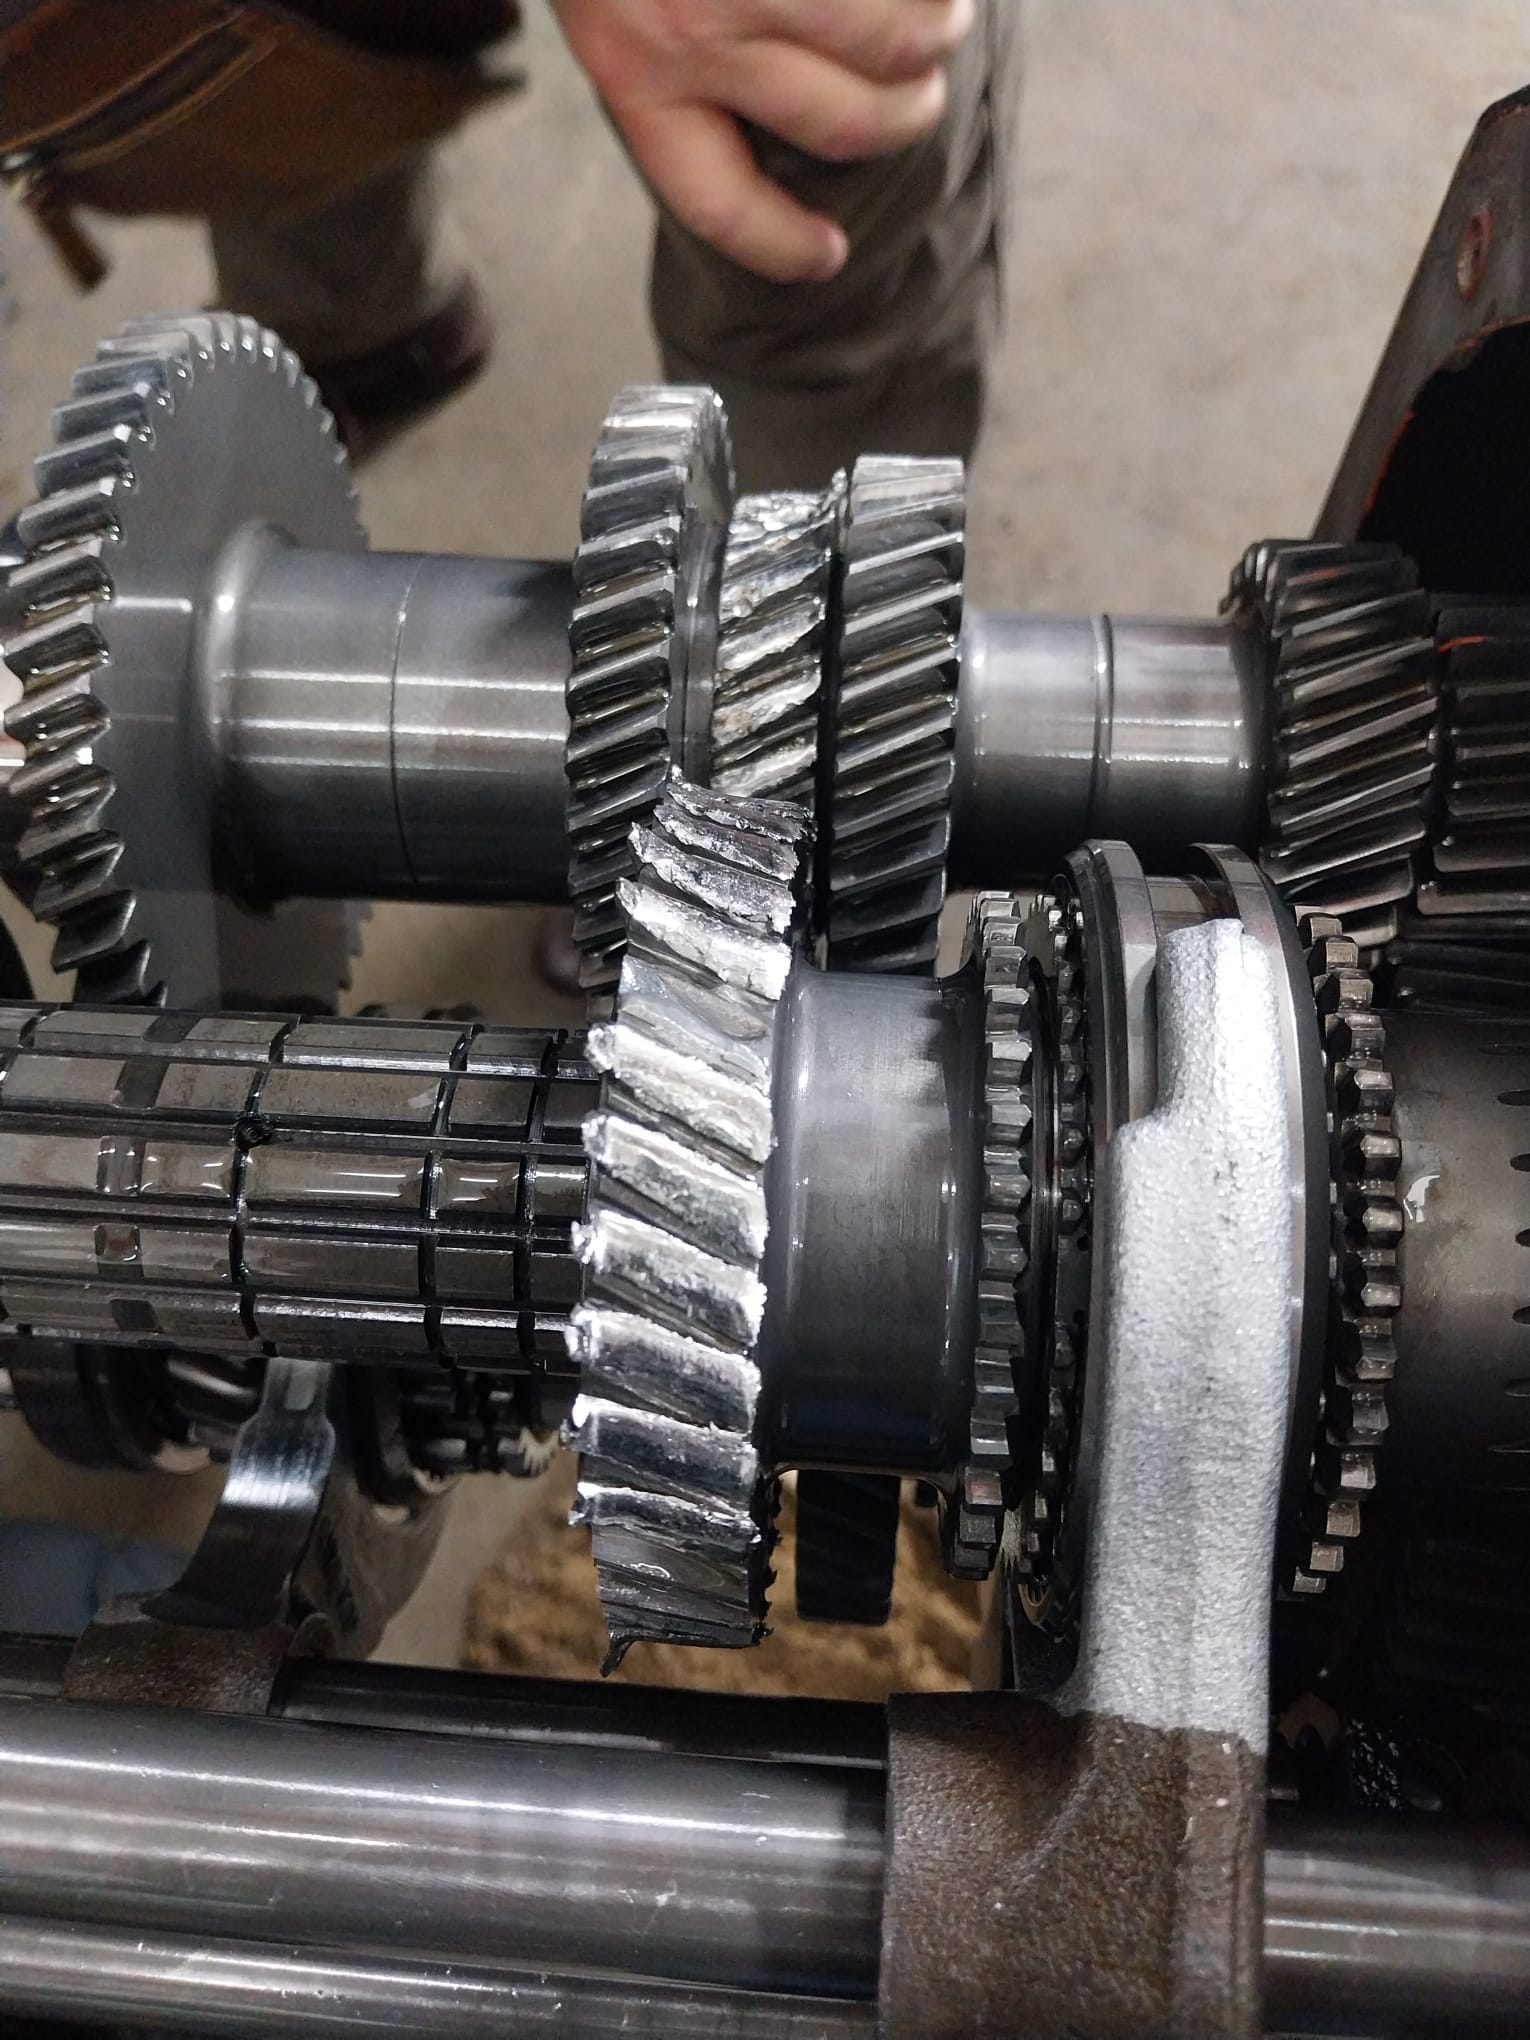
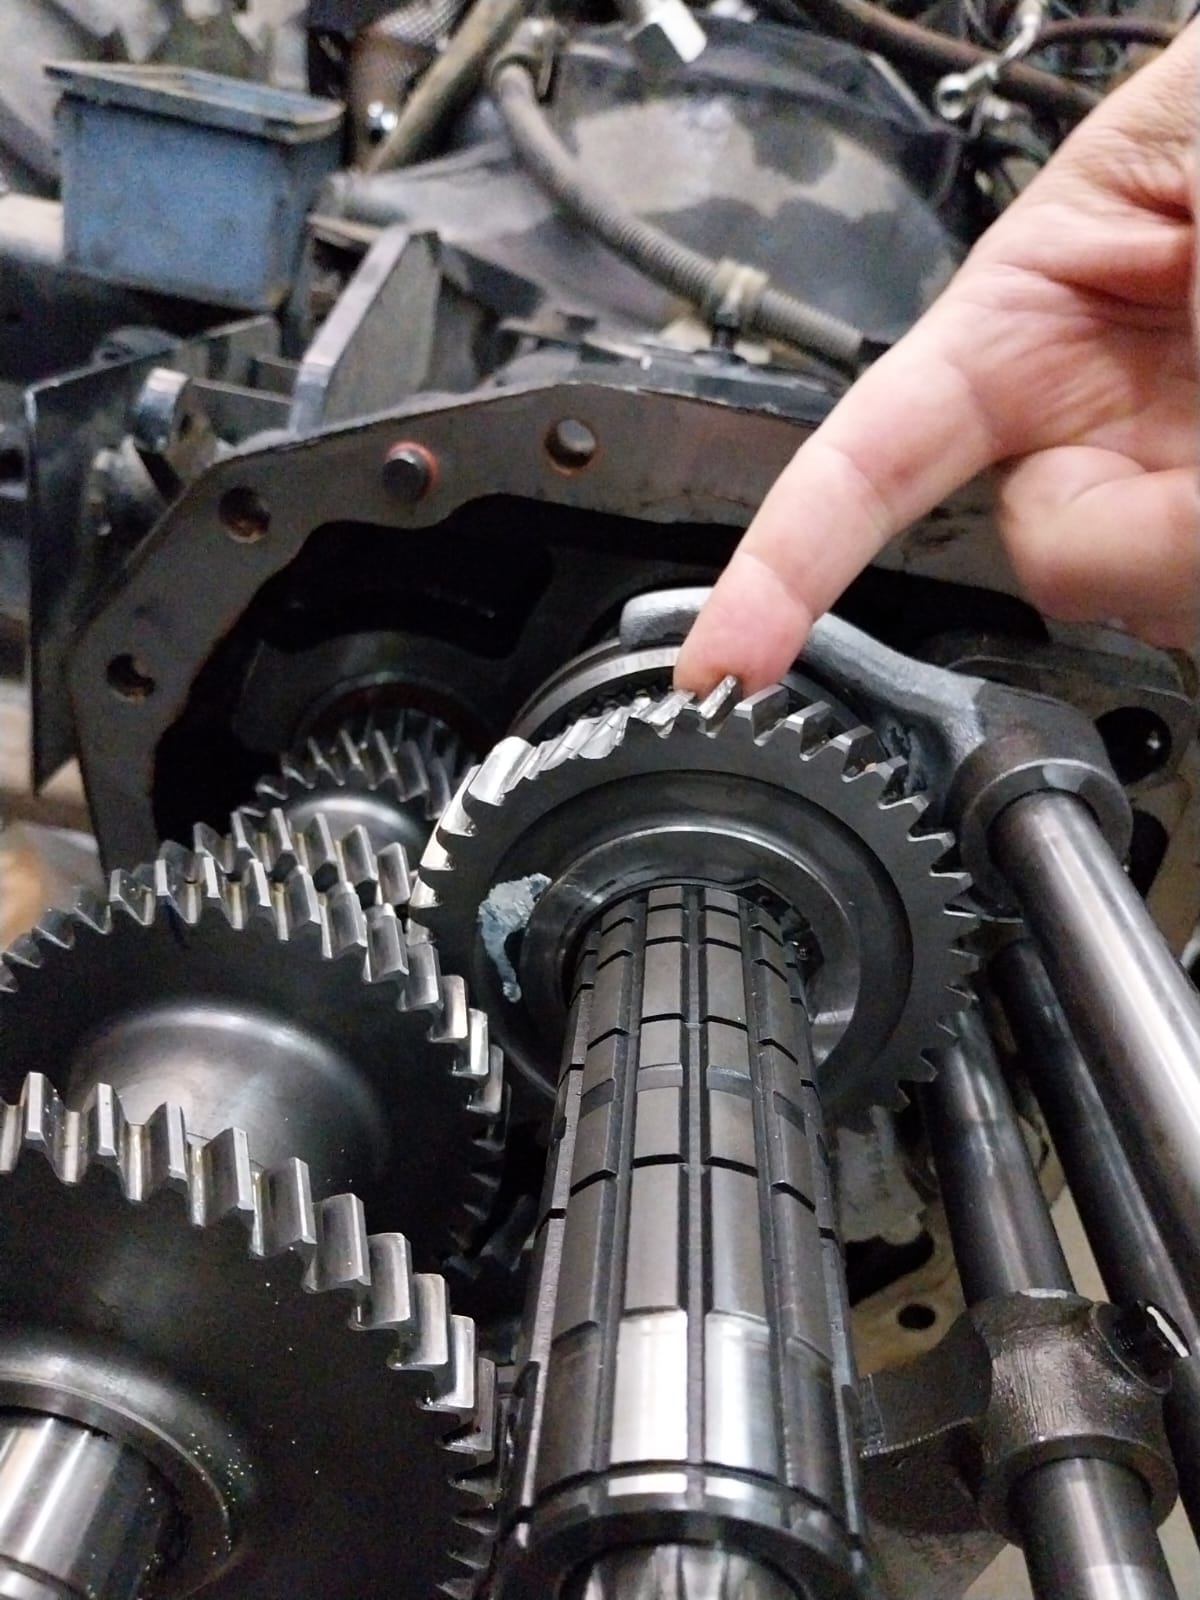
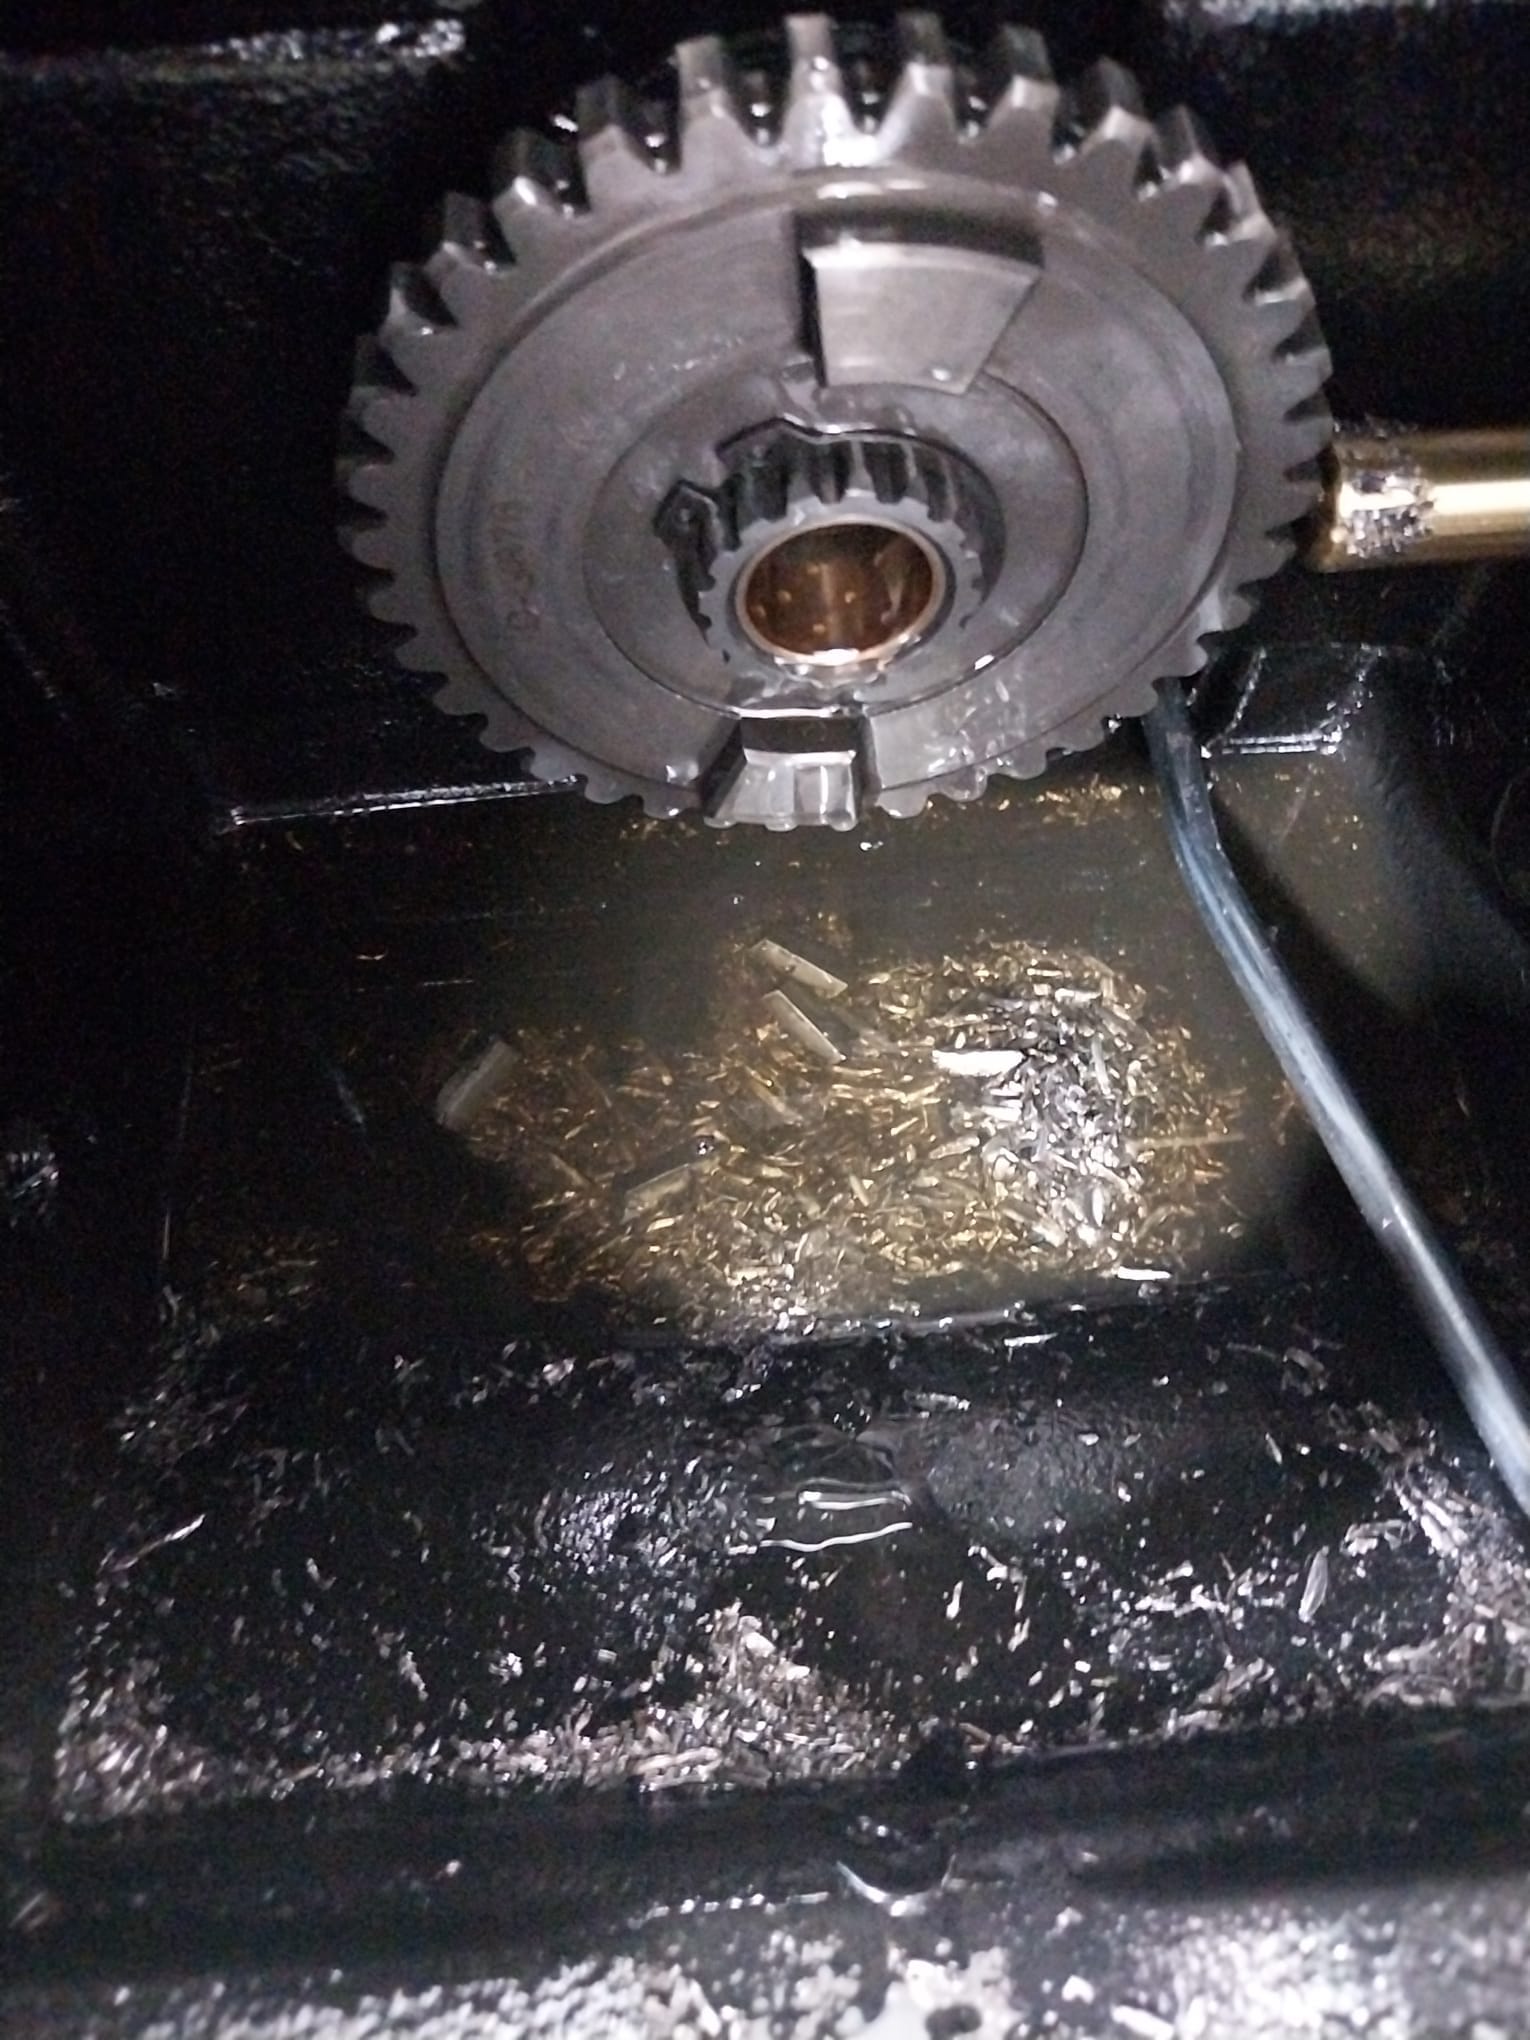
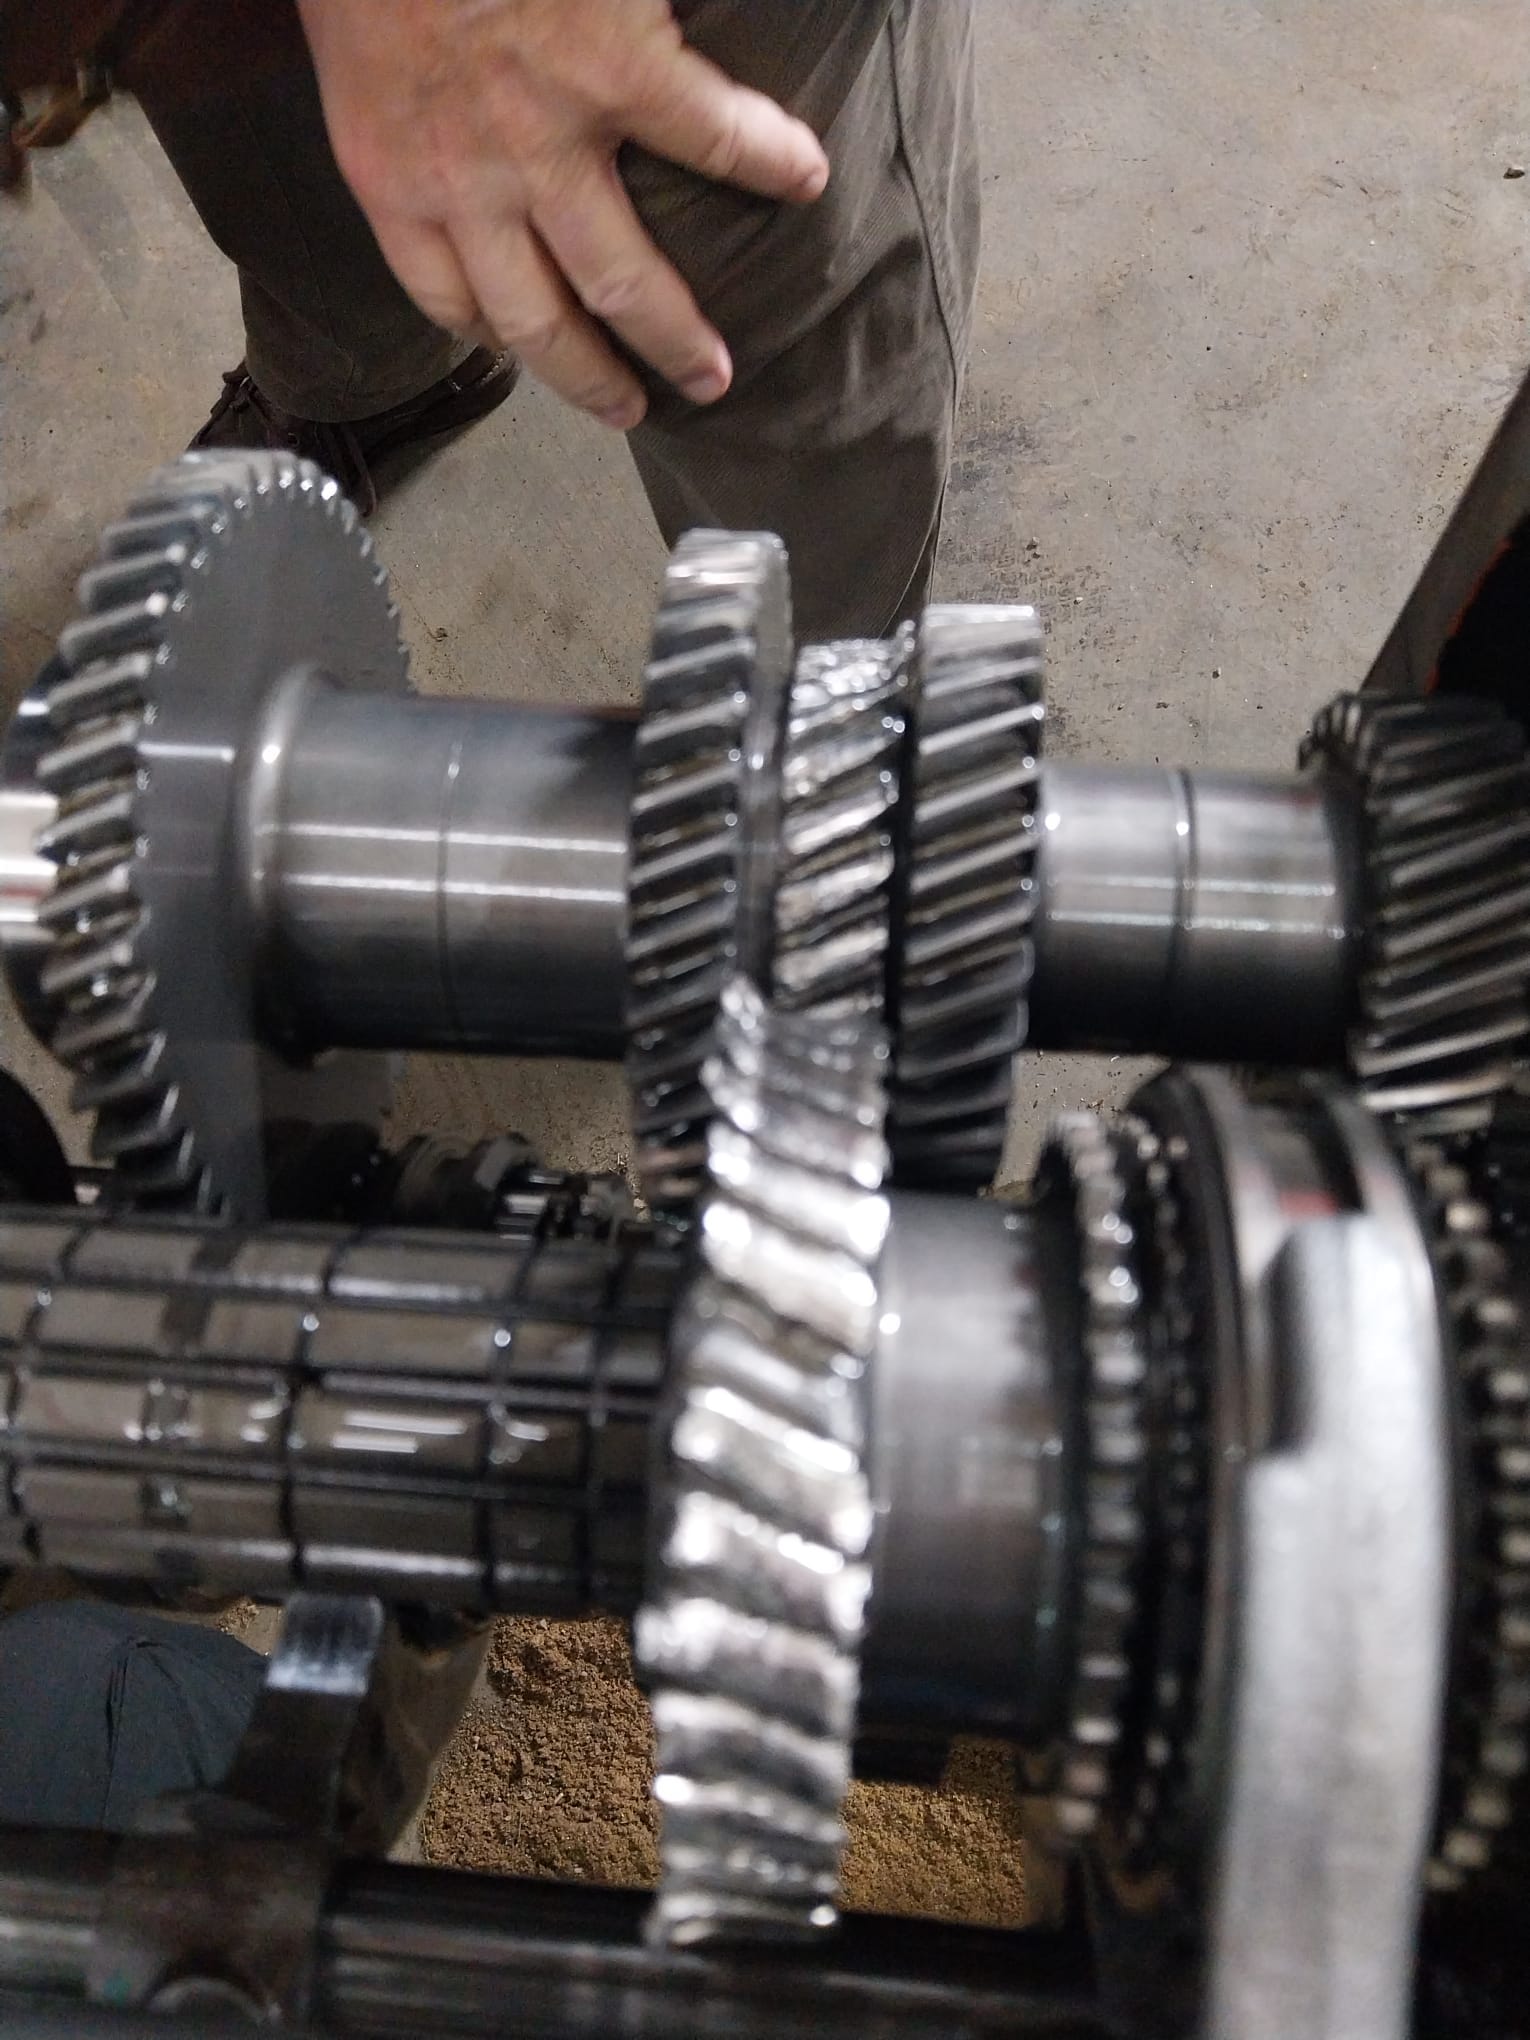
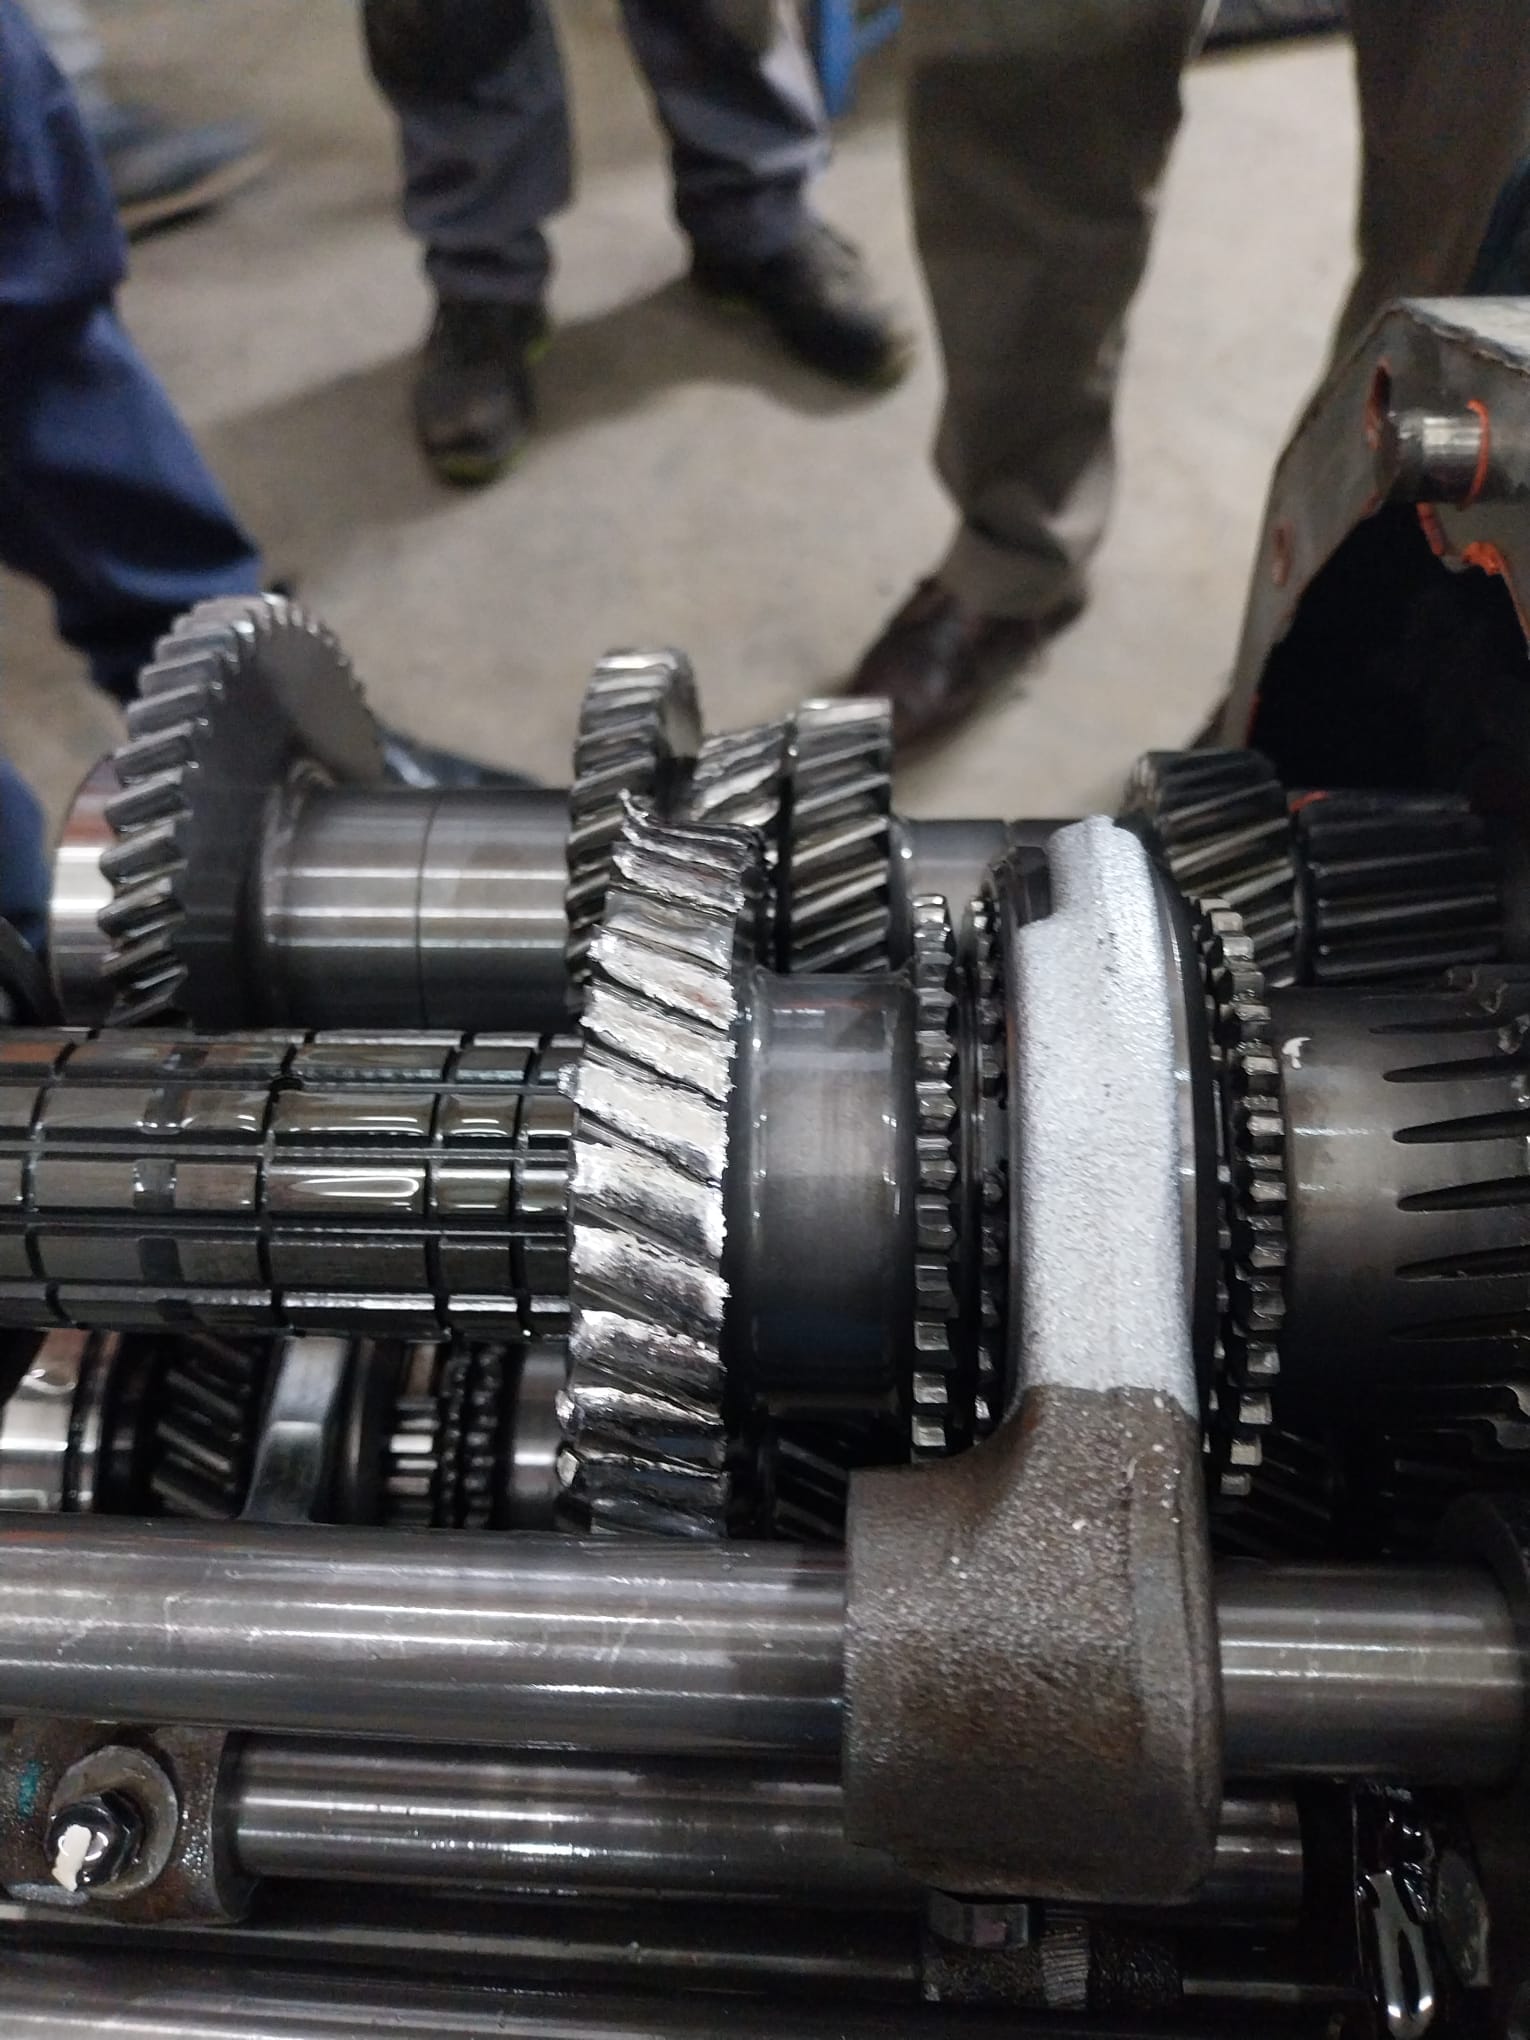
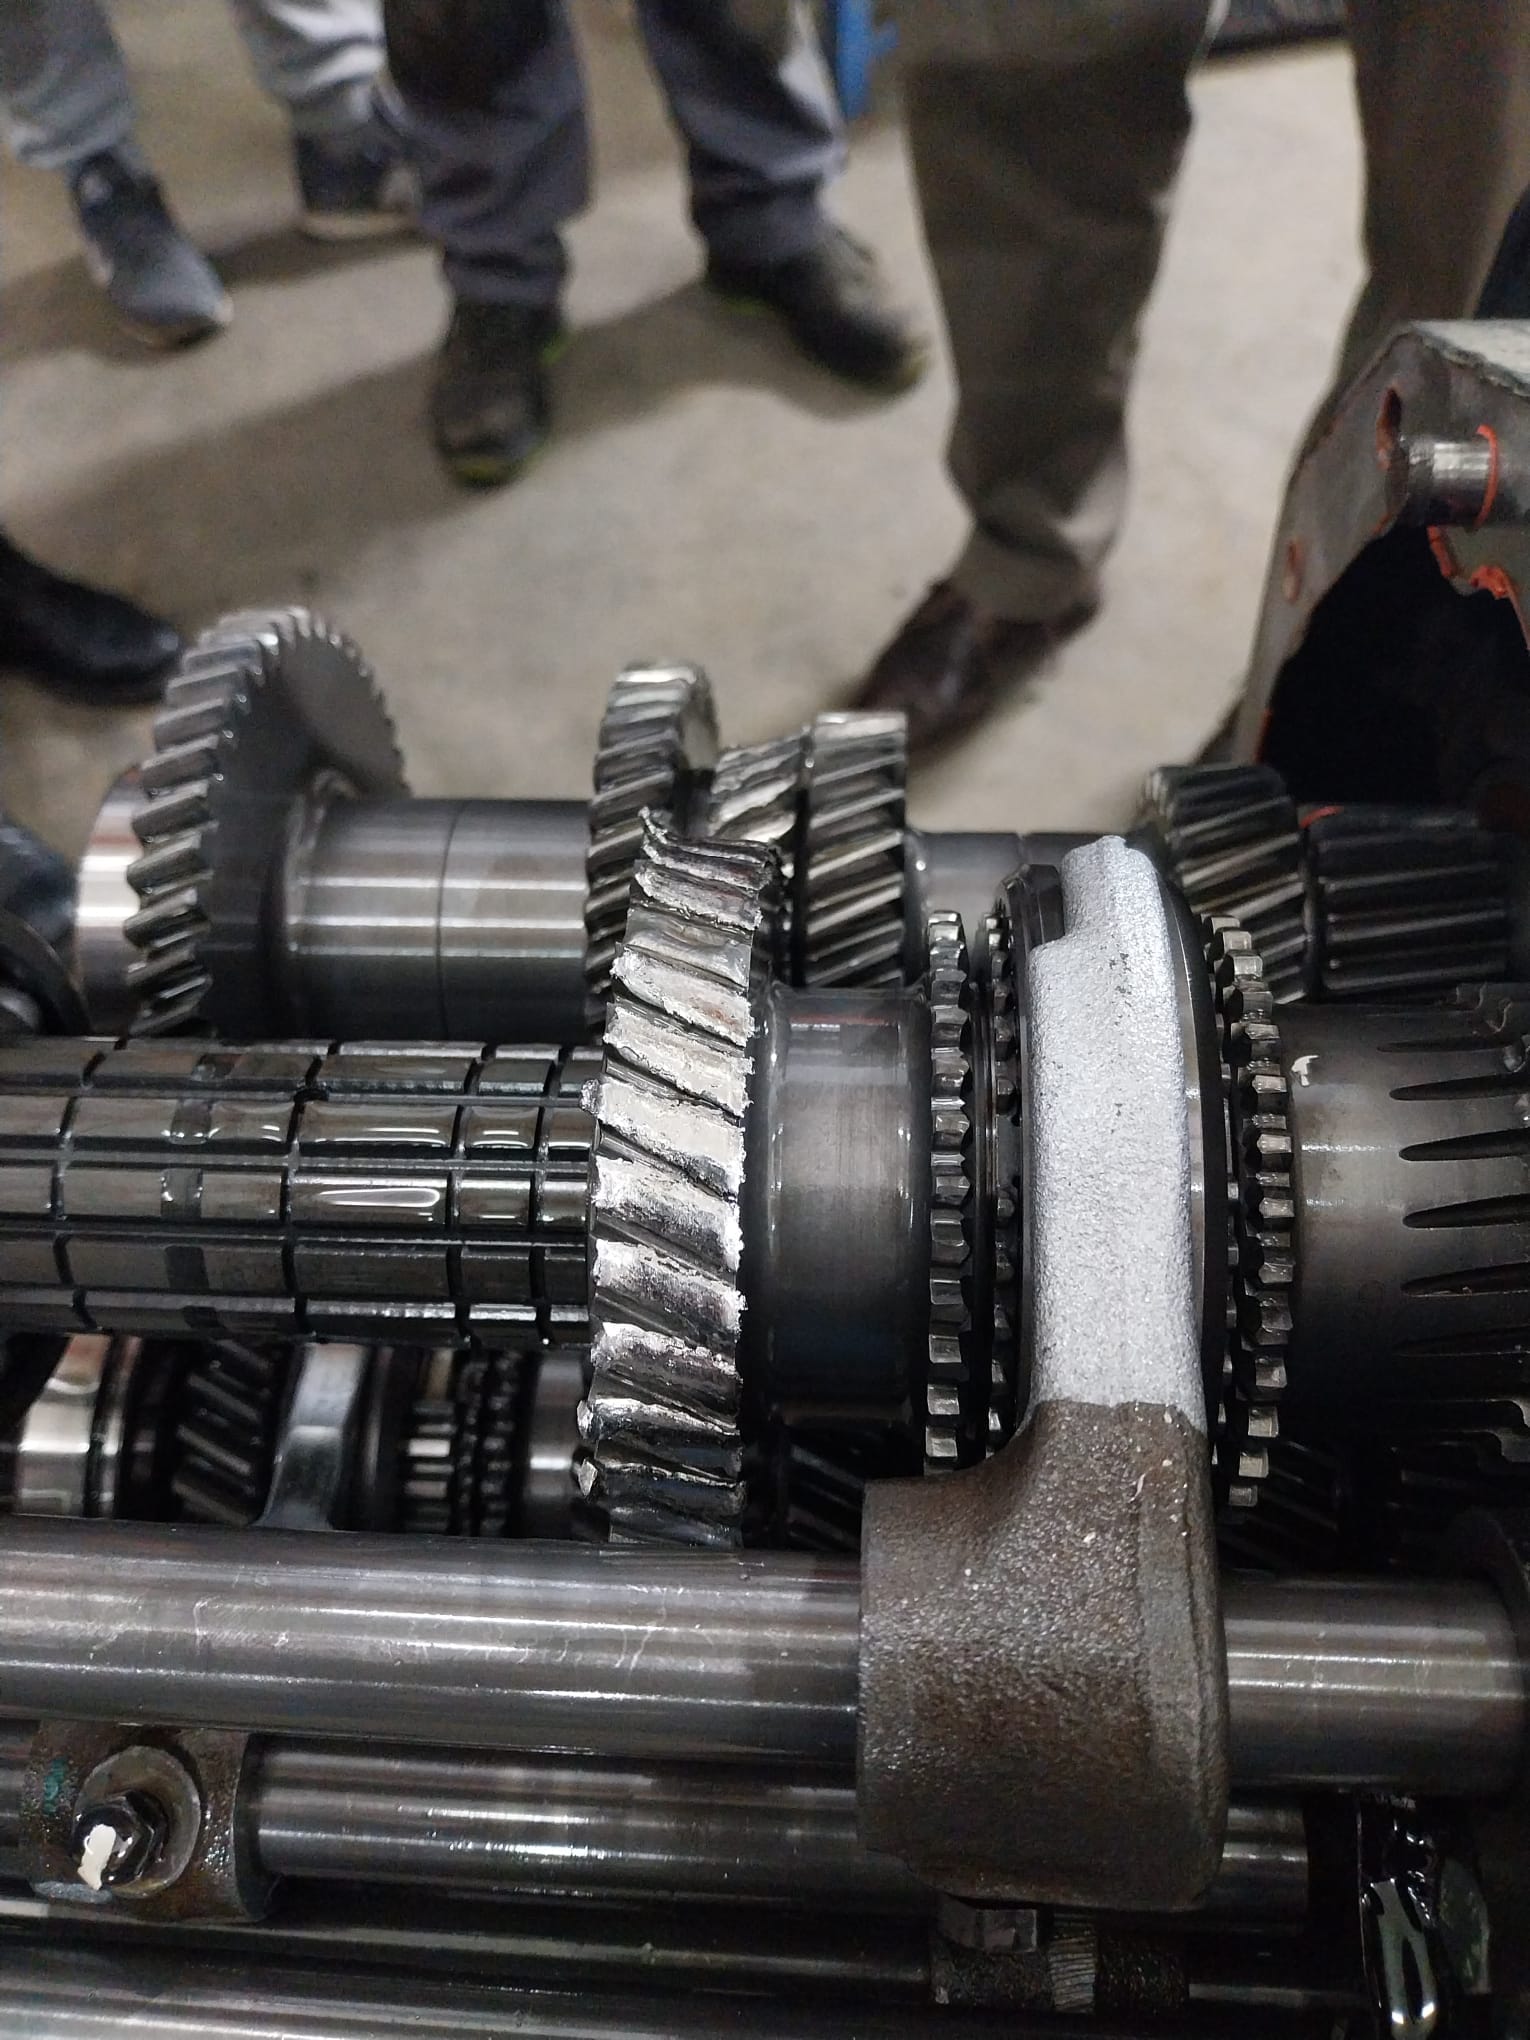
A technical inspection of the tractor gearbox revealed severe damage to the forward-drive gear pair. Although the total gear face width was 16.7 mm, the observed operating marks indicated effective contact over approximately 14.5 mm of the available tooth width, leaving approximately 2.2 mm without comparable contact marks.
The observed contact pattern indicates incomplete face-width engagement. Rather than attributing the 2.2 mm difference directly to an equivalent axial assembly error, the observed condition may be associated with shaft misalignment, axial positioning errors, or their combined effect. These possible causes are investigated through the subsequent contact analysis.
Observed damage
TECHNICAL EXPERTISE
From field evidence to the reconstructed contact state.
Technical expertise can include reconstruction of the actual contact condition, distribution of contact pressures, subsurface stresses, tooth-by-tooth load sharing, and assessment of misalignment or mounting-error effects.
For the Deutz-Fahr case, this section is where the expert evidence, measured engagement pattern and solver-based interpretation can be presented side by side.
The input data used in this case study were obtained from physical inspection and dimensional measurements of the damaged gearbox components. Rather than assuming a predefined failure cause, the observed damage, measured geometry and contact evidence are used to numerically reconstruct the operating condition that led to premature failure.
Three hypotheses are investigated: axial positioning error, shaft misalignment, and their combined effect. The numerical results are then compared with the physical evidence to identify the scenario most consistent with the observed failure.
Once the likely failure mechanism is established, optimized tooth microgeometries are evaluated under the same adverse operating condition to reduce stress concentration and improve gear durability.
Initial data for the analyzed gear set
| Parameter | Gear 1 | Gear 2 |
|---|---|---|
| Normal force | 6600 N | 6600 N |
| No. of teeth | 37 | 27 |
| Module | 4 mm | 4 mm |
| Point of load application | Pitch circle | Pitch circle |
| Helix angle | 15° | |
| Face width | 16.7 mm | 16.7 mm |
| Misalignment angle | ≈ 0.1° | |
| No. of discretization points | 128 × 32 | |
| Young's modulus | 210,000 MPa | 210,000 MPa |
SOLVER RESULTS · SHAFT MISALIGNMENT
Contact pressure and subsurface stress distributions
Numerical results for the analyzed gear pair under the specified misalignment condition. The pressure plots describe the surface contact state; the equivalent von Mises stress plots show the corresponding subsurface response along the longitudinal section through the pressure maxima.


Longitudinal pressure profile and corresponding subsurface stresses
The longitudinal pressure distribution is reproduced below at a larger scale to show the section used for the subsurface equivalent-stress analysis. The complete stress field is followed by a detailed view of the critical concentration zone.


ENGINEERING INTERPRETATION
Reverse Engineering of Gear Tooth Failure — Shaft Misalignment (0.1°)
The numerical results correspond to the gear pair described in the preceding table, considering an angular shaft misalignment of 0.1°, without additional assembly or positioning errors.
A reverse-engineering approach was adopted by investigating several misalignment angles and comparing the resulting contact pressure and subsurface equivalent von Mises stress distributions with the observed tooth damage.
Physical inspection revealed that approximately 14.5 mm of the 16.7 mm tooth face width had fractured, leaving only a 2.2 mm-wide segment intact. At a misalignment angle of 0.1°, the numerical analysis revealed pronounced edge loading, with the most severe contact pressures and subsurface stresses concentrated toward the damaged side of the tooth.
Importantly, the contact pressure distribution extends into regions beyond the fractured portion, but the corresponding von Mises stresses progressively decrease toward the opposite tooth edge. The presence of contact pressure does not necessarily imply failure across the entire loaded width, providing a plausible explanation for the survival of the remaining 2.2 mm-wide segment.
The calculated peak contact pressures and equivalent von Mises stresses are sensitive to numerical discretization, particularly near localized edge loading, and should not be interpreted as exact physical stress magnitudes. Their principal significance is to demonstrate how even a relatively small shaft misalignment (0.1°) can produce severe contact pressure and subsurface stress concentrations.
The observed correspondence between the numerical loading pattern and the physical damage geometry suggests that shaft misalignment may have been a significant contributing factor to the premature gear tooth failure. Although this correlation does not independently establish the root cause, it provides a technically grounded basis for further failure investigation. Although the calculated longitudinal contact region extends over approximately 15.5 mm, the stresses within an approximately 1 mm-wide portion may have remained below the relevant material failure threshold, allowing that portion of the tooth to remain intact.
SOLVER RESULTS · IDEAL GEARING
Contact pressure and subsurface stress distributions — ideal gearing
Reference numerical results for the original helical gear geometry under ideal alignment. Even without shaft misalignment, the helical contact geometry produces an asymmetric longitudinal pressure distribution and a localized subsurface stress concentration near the right-hand tooth edge.


Longitudinal pressure profile and corresponding subsurface stresses — ideal gearing
The longitudinal pressure distribution is repeated at a larger scale to identify the section used in the subsurface analysis. The following plots show the equivalent von Mises stress field and a close-up of the right-hand concentration zone.


Under ideal alignment, the calculated maximum subsurface equivalent von Mises stress is 1,300.0 MPa at x = 6.751 mm and z = 0.099 mm. Local edge peaks depend on discretization and the elastic contact model and should not be treated as exact physical stress magnitudes.
ENGINEERING INTERPRETATION · IDEAL GEARING
Contact behavior under ideal shaft alignment
Even under ideal shaft alignment, the numerical results reveal an asymmetric distribution of contact pressure and subsurface equivalent von Mises stress. This asymmetry is associated with the geometry and spatial orientation of the contact region in helical gears. The inclined contact lines extend across the tooth face, and the local contact geometry and relative principal curvatures vary along the contact path.
For the analyzed gear pair, the right-hand end of the contact exhibits higher local pressure and a more pronounced subsurface stress concentration than the left-hand end. The longitudinal pressure profile shows an elevated peak near the right-hand boundary, while the subsurface calculation gives a maximum equivalent von Mises stress of approximately 1,300.0 MPa at x = 6.751 mm and z = 0.099 mm.
The contact region nevertheless extends over most of the analyzed face width, indicating that the load is distributed along a substantial portion of the tooth. The end peaks are sensitive to the numerical discretization and treatment of edge contact; their magnitudes should therefore be interpreted as model predictions rather than exact physical stresses.
These ideal-alignment results establish the reference contact state of the original, unmodified helical gear geometry. A quantitative comparison with shaft misalignment and with the combined shaft-misalignment and mounting-error condition will be presented after all three scenarios have been evaluated.
SOLVER RESULTS · COMBINED MISALIGNMENT AND MOUNTING ERROR
Combined shaft misalignment (0.1°) and axial mounting error (1 mm)
Numerical contact analysis for the same helical gear pair, loading, material properties and discretization as in the preceding misalignment case, with an additional 1 mm axial positioning error relative to the driven gear. The combined deviations produce pronounced localized edge loading and a corresponding subsurface stress concentration. Peak values are sensitive to the numerical discretization and edge-contact treatment.


Longitudinal pressure profile and corresponding subsurface stresses
The longitudinal pressure distribution is reproduced below at a larger scale to show the section used for the subsurface equivalent-stress analysis. The complete stress field is followed by a detailed view of the critical concentration zone.


Compared with shaft misalignment alone (maximum subsurface von Mises stress: 1,303.0 MPa), the combined case reaches 2,024.9 MPa, an increase of approximately 55.4% for the presented numerical results. This comparison illustrates sensitivity to axial positioning errors; it should not be treated as an independently validated failure criterion.
ENGINEERING INTERPRETATION · COMBINED MISALIGNMENT AND MOUNTING ERROR
Contact behavior under combined shaft misalignment and axial positioning error
The third numerical scenario considers the same helical gear pair and loading conditions as the preceding analyses, with an angular shaft misalignment of 0.1° and an additional 1 mm axial mounting error. The combined geometric deviations modify the contact conditions and produce a pronounced, non-uniform distribution of contact pressure along the tooth face.
The three-dimensional pressure field and longitudinal pressure profile reveal a localized concentration near one end of the contact region. The contact-area plot further illustrates the extent and shape of the loaded region, while the transverse pressure distribution characterizes the local variation across the contact strip.
The subsurface calculation predicts a maximum equivalent von Mises stress of 2,024.9 MPa, located at x = −8.641 mm and a depth of z = 0.075 mm. The enlarged contour plot highlights the highly localized stress concentration beneath the heavily loaded edge.
For the shaft-misalignment-only scenario, the corresponding reported maximum was 1,303.0 MPa. Under the combined condition, the calculated maximum is therefore approximately 55.4% higher. This is a comparison between the presented numerical scenarios, not an independently established prediction of fatigue life or failure probability.
The results indicate that axial mounting errors can substantially alter the local stress response when combined with shaft misalignment. As with the other cases, the predicted peak magnitudes depend on numerical discretization, contact-edge treatment, and model assumptions. Their main engineering value is to identify critical loading regions and motivate further assessment of assembly tolerances, tooth modifications, and the observed damage pattern.
Engineering interpretation
Detailed explanation of the contact mechanism, critical locations, likely damage driver and comparison with available technical evidence.
PROPOSED GEOMETRIES · LEAD CROWNING OPTIMIZATION
Parabolic lead crowning to improve gear contact under load-induced misalignment.
An extensive numerical parameter study was performed to identify a suitable longitudinal tooth-flank modification for the investigated helical gear pair. Among the crowning magnitudes tested, a 30 μm parabolic drop at each tooth-face extremity produced the lowest reported maximum contact pressure and a smooth contact-pressure distribution without pronounced localized peaks.
Investigated operating conditions
| Normal tooth load | 6,600 N |
| Angular shaft misalignment | 0.1° |
| Axial mounting error | Negligible (close to zero) |
| Lead crowning | Symmetric parabolic, 30 μm drop per end |
| Tooth face width | 16.7 mm |
Calculated results
| Maximum contact pressure | 1,581 MPa |
| Maximum equivalent von Mises stress | 871.4 MPa |
| Location of von Mises maximum | x = −4.494 mm |
| Depth of von Mises maximum | z = 0.222 mm |
The maximum contact pressure and maximum von Mises stress are different physical quantities and must not be interpreted interchangeably.
Contact pressure distributions and contact patch
The three-dimensional pressure field, transverse and longitudinal sections, and computed contact area are presented below. The pressure maximum remains displaced toward negative x, while the modified geometry avoids a sharp localized pressure spike in the displayed results.


Subsurface equivalent von Mises stress
The elastic stress calculation gives a maximum equivalent von Mises stress of 871.4 MPa at a depth of 0.222 mm. Whether yielding occurs depends on the local yield strength of the actual gear material, its heat treatment, and an appropriate safety margin.

ENGINEERING INTERPRETATION · PREFERRED CORRECTION
30 μm lead crowning: preferred among the investigated configurations
After multiple numerical trials, a 30 μm parabolic crowning drop at each face extremity was selected as the most favorable tested configuration for the specified 6,600 N normal load, 0.1° angular shaft misalignment, and negligible axial mounting error. Such angular misalignment may arise from shaft and bearing-system deflections under substantial operating loads; its actual magnitude remains system-dependent.
The selected geometry produced a smooth, broadly distributed contact pressure field, with a calculated maximum of 1,581 MPa, and a maximum subsurface equivalent von Mises stress of 871.4 MPa. The latter is not, by itself, evidence of plastic yielding.
For material selection, suitably heat-treated high-strength gear steels such as 42CrMo4 or 34CrNiMo6, and carburized and hardened gear steel such as 18CrNiMo7-6, may be evaluated. Selection requires verification of the local yield strength at the critical depth, heat-treatment condition, contact-fatigue resistance, and an adequate safety margin; no particular steel grade is validated by this elastic analysis alone.
Scope: This optimization does not include the previously examined 1 mm axial positioning error. The 30 μm value is a preferred result within the investigated parameter range and operating condition, not a universal optimum. Additional load cases, alignment states, and numerical convergence checks are needed before a final design recommendation.
ALTERNATIVE GEOMETRY · END RELIEF


End relief: a potential manufacturing trade-off
As an alternative to full-face parabolic lead crowning, a symmetric end relief was evaluated using a 30 μm relief depth at each tooth-face extremity over 30% of the 16.7 mm face width per end (5.01 mm per end). The operating assumptions remained a 6,600 N normal tooth load, 0.1° shaft angular misalignment, and negligible axial mounting error.
Parabolic lead crowning
Maximum subsurface von Mises stress: 871.4 MPa. Preferred mechanical performance among these two investigated modifications.
End relief, 30% per end
Maximum subsurface von Mises stress: 929.9 MPa, approximately 6.7% higher than crowning. Contact pressure for this 30% configuration is not yet reported.
ENGINEERING AND MANUFACTURING TRADE-OFF
A viable alternative subject to material and cost verification
The modest 58.5 MPa difference in peak subsurface equivalent stress makes end relief worth considering as an alternative design, but does not establish equivalent contact-fatigue life or an acceptable safety factor.
A manufacturer may favor end relief where its production equipment and processes make localized end modifications more economical than full-face crowning. Lower manufacturing cost is a possibility, not an established result; it requires supplier-specific process and cost assessment.
Material selection and heat treatment must provide local yield strength exceeding 929.9 MPa by an appropriate design safety margin at the critical depth of 0.247 mm. Contact fatigue, residual stresses, actual hardness-depth profile, and other relevant failure criteria must also be checked. The calculated von Mises peak alone cannot establish service life.
Comparison scope: The 1,734 MPa contact-pressure result belongs to the earlier 20%-per-end relief configuration and must not be attributed to this 30%-per-end alternative.